
Parameters are probably one of the first things every Tableau user learned when they first started with Tableau. Let me lay the ground for those who are not sure what parameter is.
According to Tableau,
“
A parameter is a global placeholder value such as a number, date, or string that can replace a constant value in a calculation, filter, or reference line.
”
With that being said, we can simply think of parameters as a variable where users can control the value.
In this blog, I summarized a few ways to use parameters in Tableau.
- Date selection
- Date selection with a previous period comparison
- Default date when workbook opens
- Parameter as a filter substitute
- Parameter action
Now let’s see each in detail.
Date selection
A data table usually comes with a date dimension. In many cases, we want to know how data looks during a specific period. This is easy with Tableau’s filter function. We can put a date that we want to see into a filter box. The filter will only keep data of the dates that we pick. So, for what case would we use parameters for date filtering?
Date selection with a previous period comparison
Let’s say you are a store manager, you might want to monitor how much sales you are making each month, the last two months, last quarter or even last year. If you only want to know this, filters can help you with that. Of course, filters also allow users to interact with a dashboard. Users can adjust to periods of interest easily.
But, knowing how much sales they can make this month is often not enough for most business people. They may be eager to know how sales compared to past data. By past data, it could be sales in the same month last year (Year-over-Year comparison, or YoY%), sales in the same month (Month-over-Month, MoM%), or even last quarter (Quarter-over-Quarter or QoQ%).
As seen in the photo below, apart from each KPI value in the box, YoY% and MoM% are shown in the KPI cards with arrows indicating if performance improved or not.
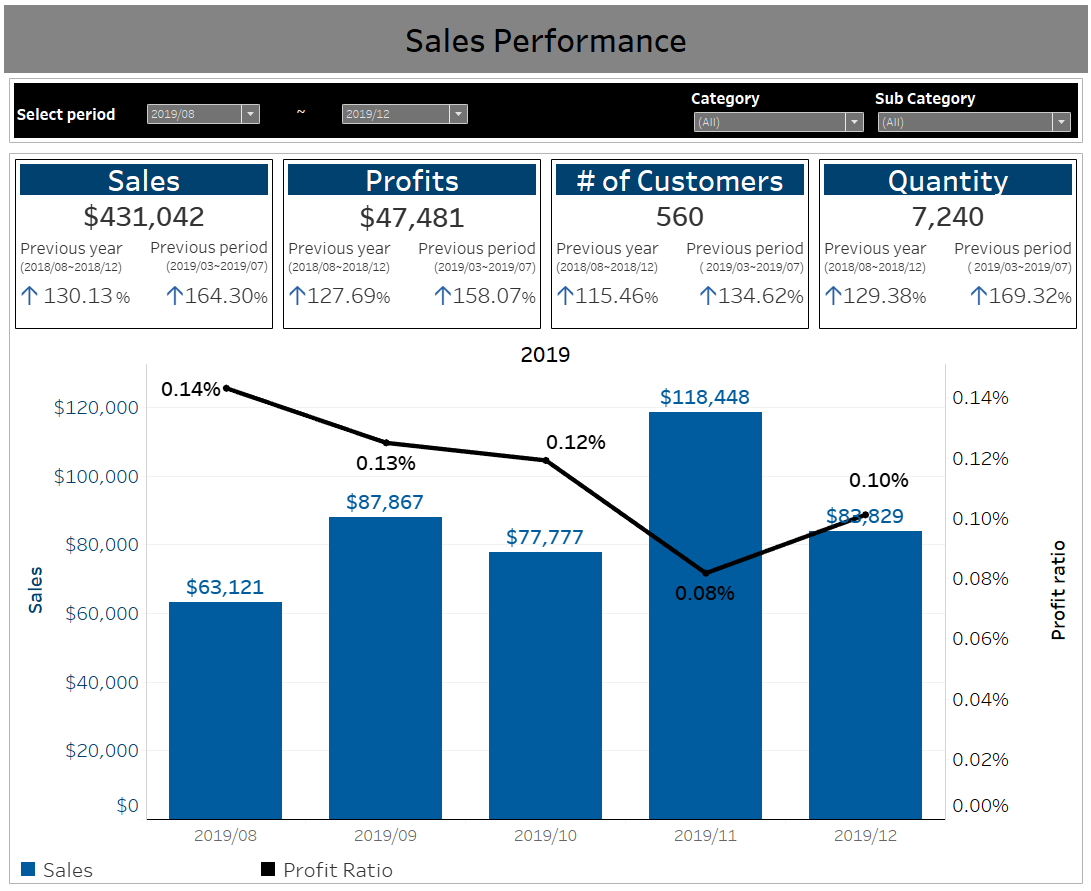
In order to find YoY% and MoM%, we use [Amount this period] ÷ [Amount previous period] (it is the same logic of the “Percent From” table calculation in Tableau). In this case, it might be difficult to just drag and drop the date dimension onto the filter box because the filter will remove past data from the views.
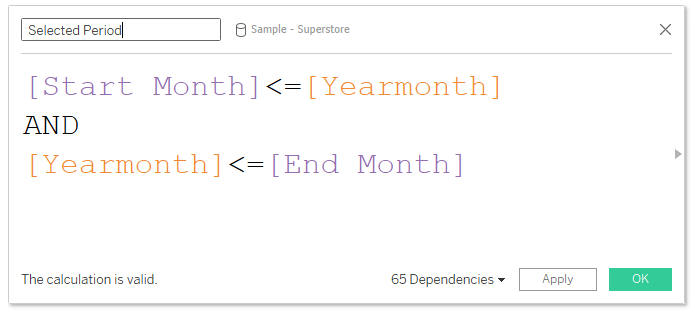
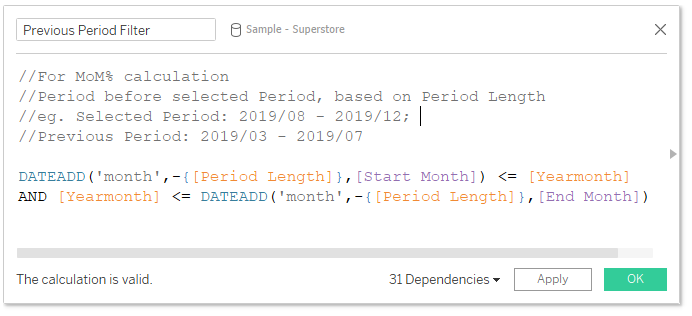
So, this is when we create parameters for starting (Start month) and ending (End month) of our selected period (2019/08 – 2019/12). In another calculated field, we use a DATEADD function with those parameters to calculate for past data (2019/03 – 2019/07 for MoM%).
From this point, further work is required to complete the KPI cards as shown, but the main concept of using parameters instead of using date filters is that it makes dashboards interactive in the same way filters do, and also keeps past data for the calculation.
Default date when workbook opens
Thanks to the launch of Tableau 2020.1, which added a new dynamic parameter function, you can set a default value when a workbook opens. Why is this a lifesaver for many people? Imagine your data is heavy, it requires some time for a dashboard to open. You thought the wait is over? Once it opens, you have to manually change the parameter value and wait for Tableau to update again.
When the workbook is first opened, most dashboard users would like to see the latest data. With a dynamic parameter, we can set the parameter value to the latest date available in the data source when the workbook opens. It helps us reduce the waiting time.
The use of a dynamic parameter is not limited to only setting the latest date. We can use it with several other calculated fields.
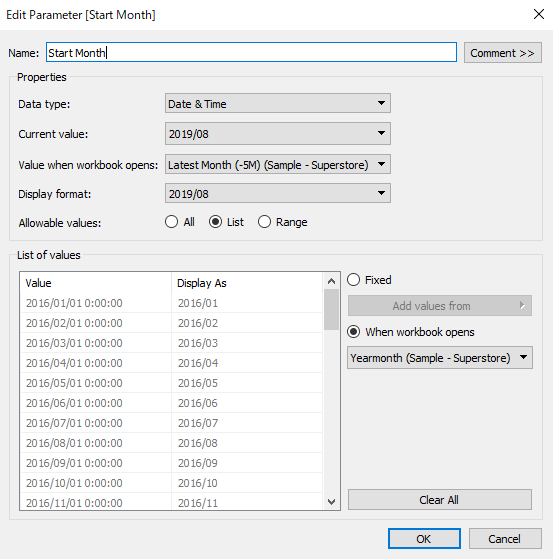
For example, consider if a client specifically requested to show the latest 5 months of data as the workbook default setting. Just as the previous example, we have Start Month and End Month parameters. All we have to do is create a new calculated field dated back from the latest month for 5 months, e.g. if the latest month is 2019/12, the new calculated field should yield 2019/08. Then I use this field in a Start Month parameter setting where it says “Value when workbook opens”.
Parameter as a filter substitute
There might be some limitations using a filter function. One of them is, of course, what we discussed earlier about the date and comparison. Still, there are many other limitations when filters cannot be used. So, we might have to switch to a parameter instead.
As you may have noticed, the category filter has the ‘(All)’ value which shows all data–meaning it is unfiltered. A parameter can do almost the same thing. We can add an ‘(All)’ value to a list of a parameter. Create a new calculated field then put it in the filter. Refer to how-to here.
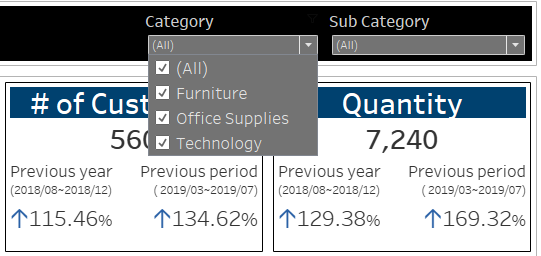
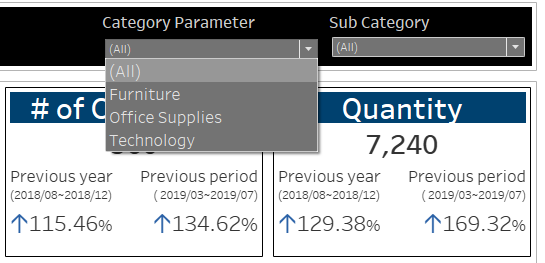
The top photo is a filter. The bottom one is made from a parameter. They look almost the same except that the one with a filter, users can select more than one value with the check boxes. Rest assured, the parameter acting as a filter gives you the same numbers, both for individual category and all category values.
Parameter action
In the above case, we have already seen some limitations of the parameter as a filter, i.e. multiple selection is not available. Luckily, Tableau also has another feature called Parameter Action.
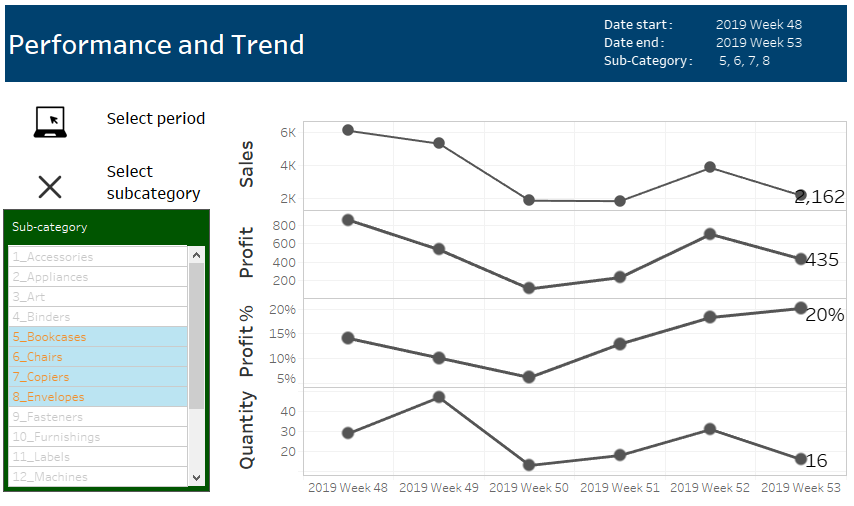
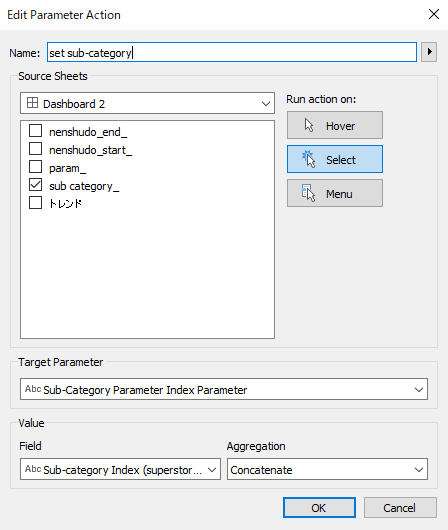
Look at this dashboard, below. The green box is a sheet filled with a list sub category values in text format. We added a parameter action on the dashboard, telling Tableau that, as this sheet as a source sheet, once a value is selected (by clicking, or hovering), it will pass this specific field’s value to a target parameter. As a result, the value of the parameter will be updated.
In addition, the action setting is set to “Concatenate,” which allows users to select multiple parameter values (holding ctrl+click). As shown, 4 sub-categories (5,6,7,8) are being selected and the line chart shows data for those 4 sub-categories.
Wrap up
Although Tableau still has some limitations, we cannot deny that data visualization is becoming a lot easier.
There are many different ways to build the dashboards while still getting the same outcome. One might need to weigh pros and cons of the ways dashboards are built, and also take dashboard maintenance into consideration.
I hope this blog could give you some ideas on how useful a parameter has become and what workarounds we can use with it.